PowerBI – Dynamic View based on Dimension Selection
I have prepared this blog from my recent interesting solution, as business team wanted to view the visuals in PowerBI based on Dimension Attribute Selection. It is pretty much easy to achieve in other Visualization Pioneer software like Tableau.
Though PowerBI comes with lot of interesting custom visuals, could not able to find a straight forward solution for the above requirements. So, In order to achieve the dynamic Dimension selection and slicing it in PowerBI, we need to do a quick work around using building a bridge and View table like below.
Attached Simple model SalesFact with Three dimensions, gives star schema for better performance as recommended by best practices with One to Many entity cardinality. We could able to denormalized and create a single table and verify the performance. We need articulate as it could increase the storage size though it could give us better query response with huge volume of data.
| DimCalendar | FactSales | DimMarket | DimOutlet | |||||
| Date | Country Code | Master Market Code | Outlet Code | |||||
| Day | Country | Master Market | Outlet Name | |||||
| Month | CalendarDate | Outlet Region | ||||||
| Year | Calendar Year | Channel | ||||||
| Day Index | calendar Month | Store Size Classification | ||||||
| Week Index | Master Market Code | Perfect Store Status | ||||||
| Month Index | Master Market | |||||||
| Year Index | Master Product Category Code | |||||||
| Fiscal Year | Master Product Category | |||||||
| Fiscal Month | Sale Quantity | |||||||
| Fiscal Day | GSV | |||||||
| COST | ||||||||
| Bridge Key | ||||||||
| BridgeTable | DimAttributeView | |
| BridgeKey | BridgeKey | |
| Master Market Code | SelectDimAttributeName | “Master Market Code”, “Outlet Code”, “Outlet Region”, “Store Size Classification” |
| Outlet Code | SelectDimAttributeValue | Values Associated for the Above List |
| Outlet Region | ||
| Store Size Classification | ||
| Perfect Store Status | ||
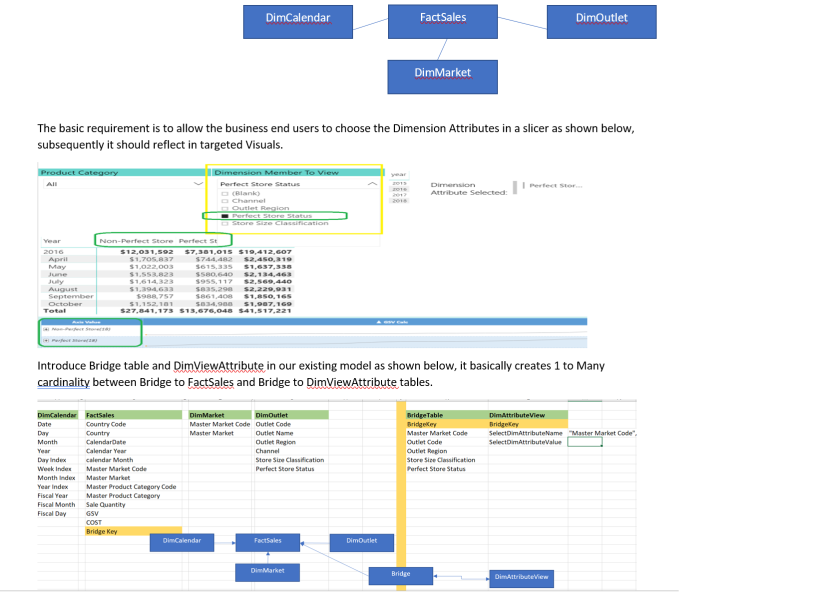
The basic requirement is to allow the business end users to choose the Dimension Attributes in a slicer as shown below, subsequently it should reflect in targeted Visuals.
By introducing a Bridge and DimViewAttribute tables in our existing model as shown below, it basically creates 1 to Many cardinality between Bridge to the core FactSales and Bridge to DimViewAttribute tables. We should enable cross filter direction to both between Bridge to DimViewAttribute table to get view changes in both direction.
We could able to do the slicing based on SelectDimAttributeName gives Attributes name and use SelectedDimAttributeValue in Visuals to make it dynamic.
Happy Learning!!
PS: i tried to include the PBI snapshot for Model and Visuals, may be i can find alternative options to make to more useful and effective…
